The challenge
Here's another cool project I have done as a part of the Udacity's self-driving car program. There were two problems solve. The first one was to find the lane lines and compute some of their properties. The second one was to detect and draw bounding boxes around nearby vehicles. Here's the result I got:
Detecting lanes
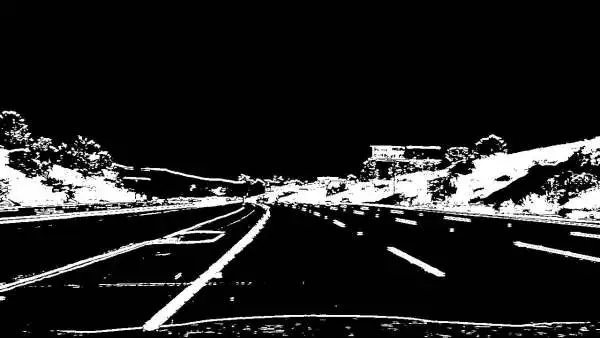
The first thing I do after correcting for camera lens distortion is applying a combination of Sobel operators and color thresholding to get an image of edges. This operation makes lines more pronounced and therefore much easier to detect.
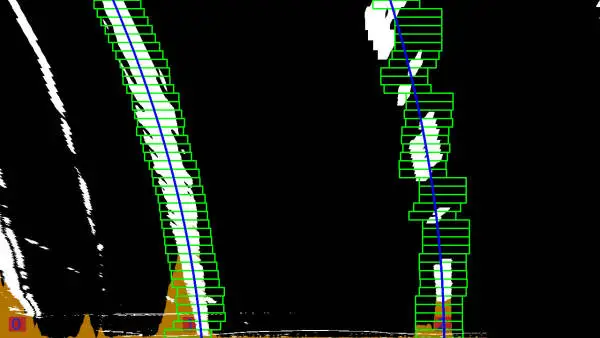
I then get a birds-eye view of the scene by applying a perspective transform and produce a histogram of all the white pixels located in the bottom half of the image. The peaks in this histogram indicate the presence of mostly vertical lines, which is what we're looking for. I detect all these lines by using a sliding window search. I start at the bottom of the image and move towards the top adjusting the horizontal position of each successive window to the average of the x coordinate of all the pixels contained in the previous one. Finally, I fit a parabola to all these pixels. Out of all the candidates detected this way, I select a pair that is the closest to being parallel and is roughly in the place where a lane line would be expected.
The orange area in the picture below visualizes the histogram, and the red boxes
with blue numbers in them indicate the positions of the peaks found by the
find_peaks_cwt function from scipy.
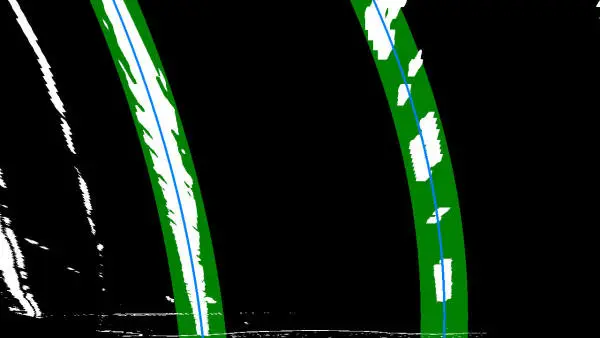
Once I have found the lanes in one video frame, locating them in the next one is much simpler - their position did not change by very much. I just take all the pixels from a close vicinity of the previous detection and fit a new polynomial to them. The green area in the image below denotes the search range, and the blue lines are the newly fitted polynomials.
I then use the equations of the parabolas to calculate the curvature. The program that produced the video above uses cross-frame averaging to make the lines smoother and to vet new detections in successive video frames.
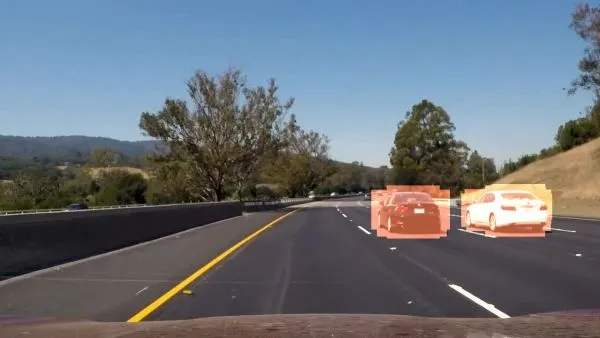
Vehicle detection
I detect cars by dividing the image into a bunch of overlapping tiles of varying
sizes and running each tile through a classifier to check if it contains a car
or a fraction of a car. In this particular solution, I used a
linear support vector machine (LinearSVC from sklearn). I also wrapped
it in a CalibratedClassifierCV to get a measure of confidence. I rejected
predictions of cars that were less than 85% certain. The classifier trained on
data harvested from the GTI, KITTI, and Udacity datasets from
which I collected around 25 times more background samples than cars to limit the
occurrences of false-positive detections.
As far as image features are concerned, I use only
Histograms of Oriented Gradients with parameters that are essentially the
same as the ones presented in this paper dealing with detection of humans.
I used OpenCV's HOGDescriptor to extract the HOGs. The reason for this is that
it can compute the gradients taking into account all of the color channels. See
here. It is the capability that other libraries typically lack limiting
you to a form of grayscale. The training set consists of roughly 2M images of
64 by 64 pixels.
Since the samples the classifier trains on contain pictures of fractions of cars, the same car is usually detected multiple times in overlapping tiles. Also, the types of background differ quite a bit, and it's hard to find images of all the possible things that are not cars. Therefore false-positives are quite frequent. To combat these problems, I use heat maps that are averaged across five video frames. Every pixel that has less than three detections on average per frame is rejected as a false positive.
I then use OpenCV's connectedComponentsWithStats to find connected components
and get centroids and bounding boxes for the detections. The centroids are used
to track the objects across frames and smooth the bounding boxes by averaging
them with 12 previous frames. To further reject false-positives, an object needs
to be classified as a car in at least 6 out of 12 consecutive frames.
Conclusions
The topic is pretty fascinating and the results I got could be significantly improved by:
- employing smarter sliding window algorithms (i.e., having momentum) to better detect dashed lines that are substantially curved
- finding better ways to do perspective transforms
- using a better classifier for cars (a deep neural network perhaps)
- using techniques like YOLO
- using something smarter than strongly connected components to distinguish overlapping detections of different vehicles - mean shift clustering comes to mind
- making performance improvements here and there (use C++, parallelize video processing and so on)
I learned a lot of computer vision techniques and had plenty of fun doing this project. I also spent a lot of time reading the code of OpenCV. It has a lot of great tutorials, but its API documentation is lacking.